How to create value in Industrials?
In November 2020, McKinsey published an interesting paper entitled “Value creation in industrials”, a survey of the US industrials sector. The purpose of the analysis was to gain insight into the factors that determine performance in the industrials sector. Value creation was used as an indicator, measured as annual growth of the total shareholder return (TSR). The research covers the period 2014–2019. So, what are the conclusions on how to create value in Industrials?
CONCLUSIONS
The industrials sector is broad and diverse. In order to compare companies in a meaningful way, McKinsey divided the sector into 90 so-called microverticals. More on that later.
The main conclusions about how to create value in Industrials:
- Even in good times, TSR performance across and within microverticals is highly variable.
- Despite the tailwind or headwind, companies ultimately determine their own destiny.
- The TSR performance gap between the best-performing and worst-performing companies within a microvertical is substantial and growing.
- Companies with strong balance sheets for 2019 have, on average, outperformed their competitors: the COVID-19 pandemic has widened the gap between the best and worst performers.
- Operational performance, and in particular margin improvement, is by far the most important factor in value creation.
HOW CAN WE COMPARE COMPANIES IN SUCH A DIVERSE INDUSTRIAL SECTOR?
While the manufacturing sector performed well at an annual growth rate of 11 per cent between 2014 and 2019, performance varied widely between the ten subsectors. Now the diversity between and within the subsectors is very great. In order to properly identify the factors that determine the performance, the study worked with 90 groups of companies that carry similar products and that focus on a similar end market: the so-called microverticals.
WHICH TRENDS ARE AFFECTING THE MICROVERTICALS?
Five categories emerge from the research: (1) regulation, (2) consumer and socio-economic, (3) technological, (4) environment, and (5) industrial structure and movements of players in the market. Any one of these trends can cause a tailwind or headwind – often both. Measured in revenue and margin growth, these trends predominantly work out well for the top-performing microverticals and negatively for some of the bottom microverticals.
COMPARING MICROVERTICALS AND COMPANIES WITHIN THEM.
First of all, the fact that the company is in a top-performing microvertical is no guarantee that it is a top performer. It can also be seen that the best-performing companies within a microvertical perform substantially better than the worst-performing companies within the same microvertical. The performance gap is substantial and growing.
McKinsey found a 2,600 base point difference in TSR between the best- and worst-performing microverticals. Approximately 30 per cent of companies performed significantly better or worse than what the performance of their microverticals would have predicted. So success depends not only on whether you are in the “right” microvertical; a company’s actions are also important. Individual companies can do a lot to determine their fate, even when headwinds and tailwinds affect microvertical performance. Furthermore, the survey found that, on average, companies with strong balance sheets for 2019 outperformed their competitors, meaning the COVID-19 pandemic has widened the gap between the best and worst performers.
WHAT CAN WE LEARN FROM THE BEST COMPANIES?
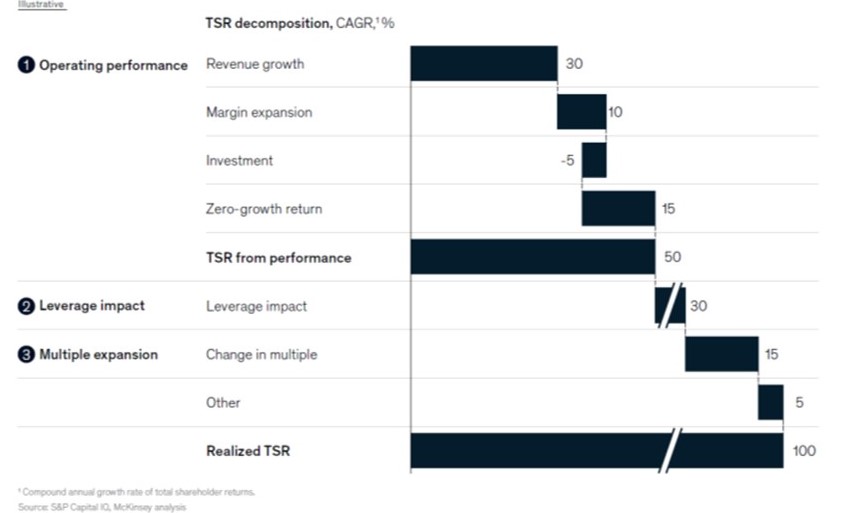
To determine which actions matter at a company level, the TSR performance of individual companies was analysed. To this end, the TSR was divided into three broad elements:
1. Operational performance
This element refers to how a company uses its capital to increase revenues and operating margins; this category also includes a company’s ability to generate value for its shareholders in a scenario with no growth and unchanged profitability. The latter is a measure of the starting position of a company.
2. Leverage
Leverage refers to how companies use debt to improve their TSR performance.
3. Multiple expansion
This element refers to opportunities to take advantage of changes in how investors see the future.
Figure 1 provides insight into the way in which companies secured their position.
Figure 1. The way in which companies secured their position.
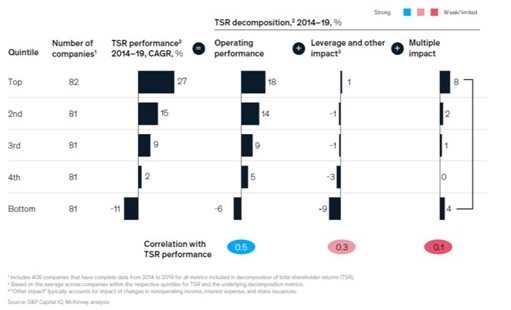
Of the three elements of TSR, operational performance was found to be the strongest predictor of TSR CAGR from 2014 to 2019 for all quintiles (Figure 2). Operational performance had the highest correlation coefficient with TSR performance, at 50 per cent, followed by leverage (about 30 per cent) and multiple expansion (about 10 per cent).
At the top-performing companies, operating performance contributed to 18 percentage points of the 27 per cent TSR growth. And for the worst performing companies −6 percentage points of −11 per cent TSR growth.
Figure 2. Operating performance had the strongest correlation with the company TSR.
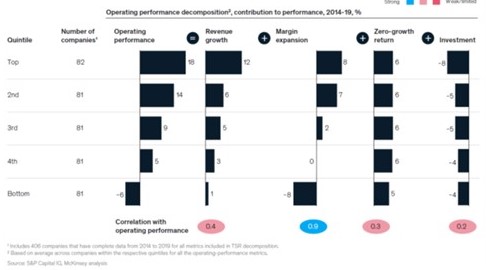
Within the operational measures, margin expansion was a major contributing factor and also the strongest determinant of the company’s TSR performance (Figure 3). With a 90 per cent correlation to business performance, the profitability extension (margin) adds an average of 8 percentage points to the 18 per cent operational performance of the top performing companies and takes 8 percentage points away from the lowest quintile companies, where the business performance is on average −6 percent.
Figure 3. From the operational statistics, margin expansion proved (often made possible by technology) the main determining factor for the company’s TSR.
Looking at the top-performing companies, it turned out that their success had depended mainly on taking three steps:
- Leveraging technology to achieve profitable growth.
- Establishing better supervision.
- Building a platform for future expansion.
HOW DO YOU ENABLE SUCCESS AND HOW DO YOU MAINTAIN IT?
To further increase the likelihood of continued success, companies need good supervision. Executives must balance their time between creating and executing strategies, and periodically reassessing and rebalancing the business portfolio. Along the way, they should look for ways to improve earning power through rapid (two-year) cycles of margin transformation, leveraging technology wherever possible.


