Are your business processes still up to the required standard?
Particularly now, in the major economic recession that has set in due to the Corona lockdowns, the quality of your business processes have to be top notch. After all, this is the determiner of the operational performance your company delivers.
Over the years your customer base will have changed, but so too has your supplier base, your products and services, your employees, your IT-infrastructure and your organisational structure. With every change your processes have been affected and now they are rather a tangled web with insufficient performance.
Understanding how your processes behave – a prerequisite for improvement
The scale of the current crisis requires companies to move quickly. You want to cut costs, slash cycle time, serve customers faster, get things right first time, improve reliability and be more agile. Therefore, you need a 100% fact-based insight into how your business processes are currently performing – and this can only be obtained through Process Mining.
Process Mining – the gateway to rapid operational performance improvement
How business processes behave is determined by the way those processes are designed and represented in IT-systems on the one hand and how your employees behave on the other. The good news is that this information is already captured in the log data in your IT-systems. This log data can be loaded from your IT-systems into the Process Mining software tool and, literally at the touch of a button, it then displays your process, as it behaves in daily reality, with all the process variants, rework loops, bottlenecks, compliance issues and more. Static, as a process flow, and dynamic, in the form of an animation. In short, a fast and effective way to understand processes and make an effective impact on those things that really matter.
The power of Process Mining
Process Mining (PM) quickly puts an end to “underbelly” discussions because it is fact-based. With PM, both the entire process and an individual case can be analysed – and everything in between. After loading your log data into PM, interactive “deep dives” can be organised with the people involved in the process. Our experience is that the root cause of problems is discovered in a short time and it quickly becomes clear which actions need to be taken to solve problems and seize opportunities.
CHALLENGE
A large global manufacturing company had over the years experienced a decline in performance at one of its sites – in production reliability, technical integrity of the equipment, efficiency and morale.
The site had recently made some improvements, but top management wanted things to change at a much faster rate. Because of its reputation to deliver fast and sustainable operational performance improvements, Axisto was invited on site to support the turnaround.
APPROACH
Our first task was to conduct a series of interviews with a cross-section of the organisation to get an initial feel for the culture and an insight into the issues the business faced. We found a lack of definition around the business processes and insufficient clarity of roles and responsibilities. As a consequence, performance management was inadequate.
Axisto and the client team worked together, first to develop a compelling vision, and then to create a well-aligned operating model with clear process flows, key performance indicators, roles and responsibilities, and an appropriate meeting and reporting structure.
By concurrently designing and implementing the improved operating model, things started to improve rapidly. People now had more clarity on what was expected from them – and also what they could expect from others. Quite quickly more effective behaviours started to develop, and with these came the desired improvements in operational performance.
Steering the company in volatile times
The coronavirus pandemic has caused a swell across business markets, in terms of both volatility and financial risk. To sail the company ship through these rough economic seas, your compass needs to be accurate and the quality of decisions and actions taken must be right. All crew members need the appropriate information to make the right decisions and act accordingly. Unfortunately, this is seldom the case. More often than not the crew sails blindfolded, unable to act effectively; the company drifts off course and targets are not met.
The Performance Management System
This is where the Performance Management System (PMS) comes in. In Part 1 we focused on an appealing vision and ambition – the dot on the horizon to sail to. In Part 2 we considered how to align the cost structure with this vision. In Part 3 we deployed the vision and ambition through all organisational levels and made sure that everyone in the company was aligned and owned the targets. In Part 4 we looked at how to design the key business processes. The PMS ties all of this together.
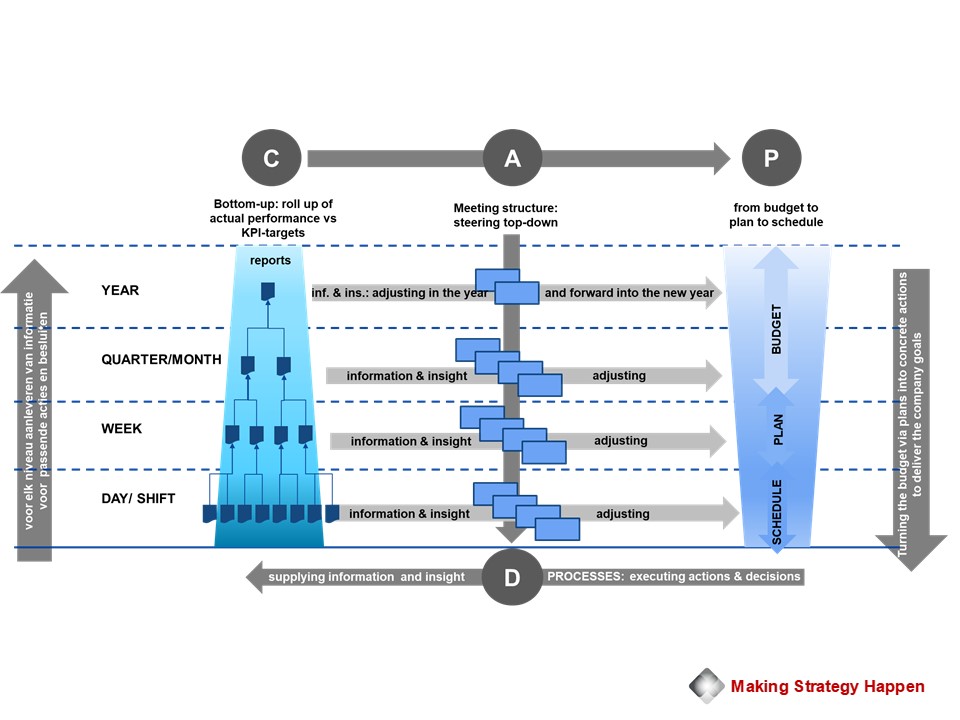
The PMS is like the control panel in the bridge of a ship. In fact, it is a set of fast and slow Plan-Do-Check-Act cycles. PDCA – the good old Deming cycle. The basic principle is shown below.
On the right is the “P” column: turning the annual budget into a daily activity schedule. The lower horizontal part is the “D” area: the actual business processes where activities are done. On the left is the “C” column: reporting actual performance against the targets. In the middle is the “A” column: the daily, weekly, monthly, quarterly and annual meetings in which actions are formulated and decisions taken to drive actual performance to KPI targets based on the information and insights supplied through the reports. The fast cycles occur shift-to-shift, day-to-day and week-to-week. Above that the slower cycles are active.
It is important to ensure that the PDCA cycles are closed and that the faster and slower ones work in synch. Closed PDCA cycles drive actual performance to KPI targets.
Purpose of the Performance Management System
The purpose of the Performance Management System is to (1) manage the organisation and the business processes to ensure delivery of the company goals, (2) support the development and continuity of effective behaviour of people at all levels in the organisation, and (3) facilitate people to work as “one team – one goal”.
Dealing with the uncertainty of “the new normal”
Many people talk about “the new normal”, but nobody really knows what it will look like. The increased volatility and financial risk will remain with us for a while; however, Robotic Process Automation (RPA) could well be a solution to help address this current uncertainty. RPA drives down costs, is adaptable to changing circumstances, reduces cycle time and increases quality. And, at the same time, RPA could be a suitable way to kick start your digital transformation journey.
Robotic Process Automation (RPA)
RPA uses digital robots (or bots) to automate mundane and repetitive tasks and processes in the workplace. A bot is a piece of software, programmed to do specific tasks on a computer. It is taught a workflow – and it can do more or less anything as long as the workflow can be defined. The bots mimic human behaviour and work well in a rule-based environment, preferably with structured data.
RPA and the operating model
In Part 5 we discussed the PMS operating model, which is supported by IT systems through the automated execution of business processes and which provides reporting functionality. In every performance improvement programme we conduct, we find that the operating model is not well-aligned with the vision and that people don’t have the information they need to do a good job. We know that the minimum requirement is decent reporting. To get this, people end up collecting bits and pieces of information from the various non-integrated IT legacy systems. Integration is costly and time consuming, so it is never done.
As a consequence, business effectiveness breaks down: employees carry out highly repetitive, boring, and transactional activities; companies handle high-volume, unstructured data in silos; data is underutilised for reporting, analysis and continuous improvement; and customers often face a fractured experience in contacting businesses. In short, high operating costs and low performance.
RPA addresses these issues fast, reliably and at a low cost. And on top of that, the programming of the bots can be easily adapted if circumstances and functionally requirements change. The bots are flexible, scaling up and down with demand.
RPA – a gateway to artificial intelligence (AI)
As RPA is IT-system agnostic it can interact with any technology platform. The bots can collect and process data from various cognitive technologies such as machine learning and computer vision – indeed, Optical Character Recognition (OCR) is a broadly applied technology.
We don’t see RPA having a long-term future on its own, but we do see it as a crucial piece in the puzzle of a true digital operating model that includes artificial intelligence. Dealing with the consequences of the coronavirus pandemic is, as we see it, a great time to kick start your digital transformation journey.
CHALLENGE
A firm specialising in electrical and mechanical engineering had decided to introduce process mining in the organisation, and wanted to develop the skills “in-house”.
Before finalising the details, the firm wanted to gain more insight in three areas: the degree of suitability in its own business process environment, the actual possibilities of process mining and what a well-fitting package would be.
The firm decided to undertake a proof of concept (PoC) for this purpose, and asked Axisto to carry it out.
APPROACH
The initiative was driven by the ICT department. They provided a two-person team for us to work with, and a project sponsor was quickly found. With the project team in place we decided to run the proof of concept on the auxiliary equipment management (AEM) process.
There were three questions to be answered:
Are the existing IT systems, their current setup and the data quality suitable?
Can the crucial questions related to performance issues be answered?
When compared with the current analysis tools available in-house, does Process Mining add value?
The firm was also interested in additional dashboarding functionality, so for the PoC we chose a process mining package that would provide this extra information. We also demonstrated a package that was more geared around pure project-based process analyses. Each package was deployed very differently in the organisation
WHY ORGANISATIONAL ALIGNMENT?
We live in a time of unprecedented change and uncertainty. For a company to be successful in this day and age, it must stay alert to changing situations and always be one step ahead of the market. This is only possible if departments are properly connected and able to move quickly with each other in the event of necessary short-term adjustments – and do so without losing sight of the longer-term aims.
In this respect it is comparable to a flock of starlings. They fly close together, all at the same speed. Each starling keeps an eye on up to seven of its neighbours and reacts very quickly should any of them change direction. This allows the swarm to move quickly without collision and change direction as a unit to avoid problems.
Their short-term changes in direction are not a sign of opportunistic behaviour; they could be a response to an attacking bird of prey. The ultimate goal is clear and will be achieved.
WHAT IS ORGANISATIONAL ALIGNMENT?
Organisational alignment means that vision, strategic goals, targets, the operating model, behaviour and skills of the people in the organisation are in line with each other. This is shown in the figure below.
HOW TO ACHIEVE ORGANISATIONAL ALIGNMENT?
COMPELLING VISION
Alignment starts with a compelling vision – one that connects, inspires and appeals to the different populations within the company. It is important that everyone in the organisation feels as if they own the vision.
This sense of ownership will not come about simply by organising a few sessions with the leadership team and company-wide communication. Instead, it is a journey that starts at the top, but then goes through all levels of the organisation. At the end of that journey is a vision that everyone has contributed to, recognises and wants to go for.
Incidentally, a vision is not static and will continue to evolve in line with developments in technology, the market, society, amongst other things. The people in the organisation do need sufficient stability. That is why an appealing vision consists of a fixed part that always remains and a variable part that always develops.
STRATEGIC GOALS
However appealing a vision is, it is relatively worthless if it does not translate into a set of strategic goals with targets (Key Performance Indicators, or KPIs) – not just at the top of the organisation, but at all levels including the shop floor.
This process of cascading goals and targets is a delicate one. The goals and targets at the top of the company must be achieved, while department heads and team leaders must accept their derived goals and targets. Good insight into the current performance, the formulation of SMART goals (Specific, Measurable, Achievable, Realistic and Time based) and a careful dialogue support the acceptance process. There must be strong ownership of the goals and targets for them to be realised.
ANCHORING IN THE DAILY RUNNING OF THE BUSINESS
Subsequently, the plans and targets are anchored in the day-to-day running of the organisation. This requires transparency of actual performance against the KPI targets as well as attitudes and behaviours that drive the actual performance towards the targets.
An operating model that is aligned with the vision and strategic goals provides this transparency and supports the development and maintenance of effective attitudes and behaviours.
ORGANISATIONAL ALIGNMENT – A KEY TO SUCCESS
If vision, strategic goals, targets, operating model, behaviour and skills of the people are aligned, the organisation can quickly and adequately navigate changing circumstances without losing sight of its longer-term goal and realise its ambition.
CHALLENGE
An electronic components manufacturer wanted to integrate two manufacturing sites, improve product quality and refocus the demand generation.
APPROACH
Four-week Analysis & Design to align the management teams of both sites, design a process and structure to manage the sites in an integrated way, understand how to tackle the product quality issues, design the steps to refocus the demand generation and design the change programme.
en-month programme to implement the new management process, structure and team. Improved product quality by applying 6-Sigma tools. Installed TPM and improved both maintenance productivity and equipment availability. Moved most of the quality assurance to the operators and took out related quality resources. Changed sales from product push to market pull and aligned the innovation portfolio.
In November 2020, McKinsey published an interesting paper entitled “Value creation in industrials”, a survey of the US industrials sector. The purpose of the analysis was to gain insight into the factors that determine performance in the industrials sector. Value creation was used as an indicator, measured as annual growth of the total shareholder return (TSR). The research covers the period 2014–2019. So, what are the conclusions on how to create value in Industrials?
CONCLUSIONS
The industrials sector is broad and diverse. In order to compare companies in a meaningful way, McKinsey divided the sector into 90 so-called microverticals. More on that later.
The main conclusions about how to create value in Industrials:
Even in good times, TSR performance across and within microverticals is highly variable.
Despite the tailwind or headwind, companies ultimately determine their own destiny.
The TSR performance gap between the best-performing and worst-performing companies within a microvertical is substantial and growing.
Companies with strong balance sheets for 2019 have, on average, outperformed their competitors: the COVID-19 pandemic has widened the gap between the best and worst performers.
Operational performance, and in particular margin improvement, is by far the most important factor in value creation.
HOW CAN WE COMPARE COMPANIES IN SUCH A DIVERSE INDUSTRIAL SECTOR?
While the manufacturing sector performed well at an annual growth rate of 11 per cent between 2014 and 2019, performance varied widely between the ten subsectors. Now the diversity between and within the subsectors is very great. In order to properly identify the factors that determine the performance, the study worked with 90 groups of companies that carry similar products and that focus on a similar end market: the so-called microverticals.
WHICH TRENDS ARE AFFECTING THE MICROVERTICALS?
Five categories emerge from the research: (1) regulation, (2) consumer and socio-economic, (3) technological, (4) environment, and (5) industrial structure and movements of players in the market. Any one of these trends can cause a tailwind or headwind – often both. Measured in revenue and margin growth, these trends predominantly work out well for the top-performing microverticals and negatively for some of the bottom microverticals.
COMPARING MICROVERTICALS AND COMPANIES WITHIN THEM.
First of all, the fact that the company is in a top-performing microvertical is no guarantee that it is a top performer. It can also be seen that the best-performing companies within a microvertical perform substantially better than the worst-performing companies within the same microvertical. The performance gap is substantial and growing.
McKinsey found a 2,600 base point difference in TSR between the best- and worst-performing microverticals. Approximately 30 per cent of companies performed significantly better or worse than what the performance of their microverticals would have predicted. So success depends not only on whether you are in the “right” microvertical; a company’s actions are also important. Individual companies can do a lot to determine their fate, even when headwinds and tailwinds affect microvertical performance. Furthermore, the survey found that, on average, companies with strong balance sheets for 2019 outperformed their competitors, meaning the COVID-19 pandemic has widened the gap between the best and worst performers.
WHAT CAN WE LEARN FROM THE BEST COMPANIES?
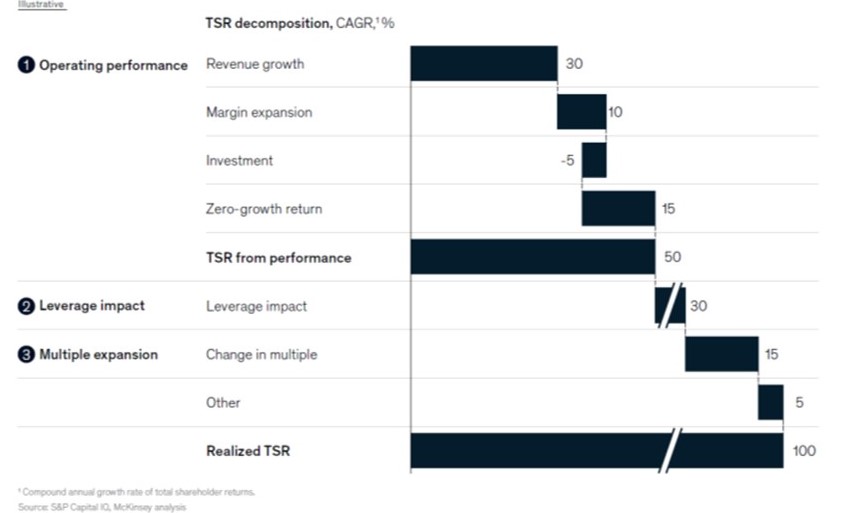
To determine which actions matter at a company level, the TSR performance of individual companies was analysed. To this end, the TSR was divided into three broad elements:
1. Operational performance
This element refers to how a company uses its capital to increase revenues and operating margins; this category also includes a company’s ability to generate value for its shareholders in a scenario with no growth and unchanged profitability. The latter is a measure of the starting position of a company.
2. Leverage
Leverage refers to how companies use debt to improve their TSR performance.
3. Multiple expansion
This element refers to opportunities to take advantage of changes in how investors see the future.
Figure 1 provides insight into the way in which companies secured their position.
Figure 1. The way in which companies secured their position.
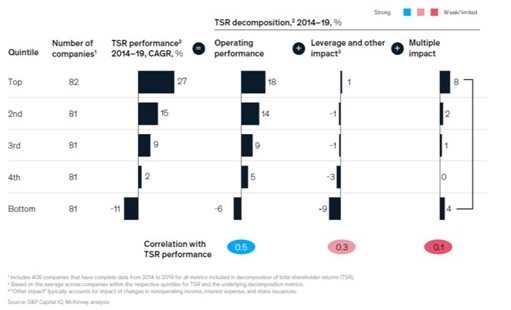
Of the three elements of TSR, operational performance was found to be the strongest predictor of TSR CAGR from 2014 to 2019 for all quintiles (Figure 2). Operational performance had the highest correlation coefficient with TSR performance, at 50 per cent, followed by leverage (about 30 per cent) and multiple expansion (about 10 per cent).
At the top-performing companies, operating performance contributed to 18 percentage points of the 27 per cent TSR growth. And for the worst performing companies −6 percentage points of −11 per cent TSR growth.
Figure 2. Operating performance had the strongest correlation with the company TSR.
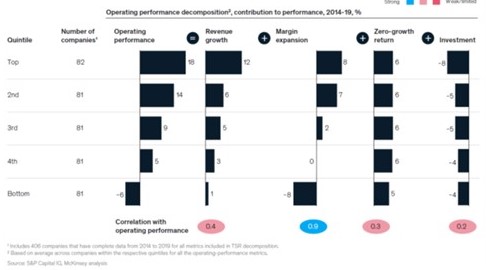
Within the operational measures, margin expansion was a major contributing factor and also the strongest determinant of the company’s TSR performance (Figure 3). With a 90 per cent correlation to business performance, the profitability extension (margin) adds an average of 8 percentage points to the 18 per cent operational performance of the top performing companies and takes 8 percentage points away from the lowest quintile companies, where the business performance is on average −6 percent.
Figure 3. From the operational statistics, margin expansion proved (often made possible by technology) the main determining factor for the company’s TSR.
Looking at the top-performing companies, it turned out that their success had depended mainly on taking three steps:
HOW DO YOU ENABLE SUCCESS AND HOW DO YOU MAINTAIN IT?
To further increase the likelihood of continued success, companies need good supervision. Executives must balance their time between creating and executing strategies, and periodically reassessing and rebalancing the business portfolio. Along the way, they should look for ways to improve earning power through rapid (two-year) cycles of margin transformation, leveraging technology wherever possible.
CHALLENGE
Our client, a global leader in the field of engineered capital goods for energy and telecoms, was facing a strongly increasing demand after an economic downturn and was struggling with production reliability at all stages of the production process.
The unreliability led to falling output, less time for equipment maintenance and delivery unreliability to their clients.
Therefore, the situation had to be brought under control quickly.
APPROACH
As each of the supervisors had a very different vision of what he was trying to achieve, our starting point was to create a detailed, tangible, operational vision of production: what it would look like, how it should be run.
Together we turned this in well-designed production management system, a set of improvement targets and an implementation plan. This approach generated a lot of energy and a strong desire for change.
During the implementation the atmosphere in the factory changed quickly from finger-pointing to a more contructive one of cooperation and joint responsibility. The plant’s performance stabilised and halfway into the project, the annual production output was ahead of budget and payroll costs were below target.
Industry 4.0 is in the spotlight. And rightly so. The possibilities are great: higher productivity, a better customer experience, lower costs and perhaps a new business strategy with innovative products and services. And there is an outright need: without Industry 4.0 a company has a limited future. Unfortunately, many Industry 4.0 implementations get stuck. Let’s find out why this happens and how to prevent it happening to you.
DATA
There can be three issues with data: not good, not available, poor quality. This is often due to IT systems not being set up properly, data not being entered or being entered incorrectly, log switches to register log data not being set correctly, or the data entered being of poor quality.
In addition, the knowledge of business processes is seldom up to standard. How do processes behave in daily practice? How should they run? This means that people are unclear as to which data should be captured and how the data should be managed.
It is therefore important to know the business processes and how they work both in theory and in practice. This is the basis for a good KPI and reporting structure. Getting this right will ensure clarity around which data must be collected, which information is required for whom at what time and how to manage the processes for maximum effect. It will also mean that data availability and quality will increase – thus building the foundation for Industry 4.0.
ORGANISATIONAL SILOS
Many companies still have a strong departmental orientation instead of an end-to-end process focus. This leads to limited insight into and understanding of the interdependencies between functions and departments. A strong departmental orientation also means that data is locked up in silos.
Industry 4.0 focuses on the integrated control of the end-to-end processes that run through various departments and even across company boundaries. That is why departments are asked to work together seamlessly and to share data and information. An effective IT infrastructure facilitates this.
CAPABILITIES TO COLLECT AND USE DATA
The introduction of Industry 4.0 requires a significantly higher level of knowledge of the
industry, of business processes and of analysis applications. At every level in the company and within every position, people must be able to handle data well and be skilled in its analysis.
The technical structure of these cyber-physical systems is becoming more complex, and more and more decisions are being made by algorithms. Therefore, it is important that companies develop the knowledge and skills to build applications and assess the behaviour of algorithms and the insights they provide. The introduction of Industry 4.0 requires intensive collaboration between departments and disciplines to develop people and resources at pace.
VISION AND ORGANISATIONAL ALIGNMENT
The introduction of Industry 4.0 affects all aspects of an operating model. The top team needs a shared vision about the value that is required for various stakeholders, and how that value is delivered – the operating model.
Too often, a joint vision is ill-considered and not adequately thought through, resulting in insufficient alignment with the roadmap. In such a situation, an implementation inevitably comes to a standstill.
THE HUMAN FACTOR
The biggest challenge in an Industry 4.0 implementation is not so much choosing the right technology, but dealing with the absence of a data-based and digital performance culture and the corresponding skills gap in the organisation. Investing in the right technologies is important – but success or failure ultimately does not depend on specific sensors, algorithms or analysis programs. The crux lies in a wide range of people-oriented factors.
Since Industry 4.0 transcends not only internal departments but also the boundaries of the company, its success is predominantly dependent on skillful change management.
CONCLUSION
In essence, the reasons why Industry 4.0 implementations get stuck are no different than with other company-wide transformations whose aim is to create a sustainably high-performing organisation. It will not surprise you that the chance of failure is roughly the same: 70%.
Therefore, in the first instance, do not focus too much on just the technical side of the transformation. Instead, concentrate on skilful change management. The technological content side of the transformation is not your main problem. The development of a data-based and digital performance culture and the corresponding skills set is.

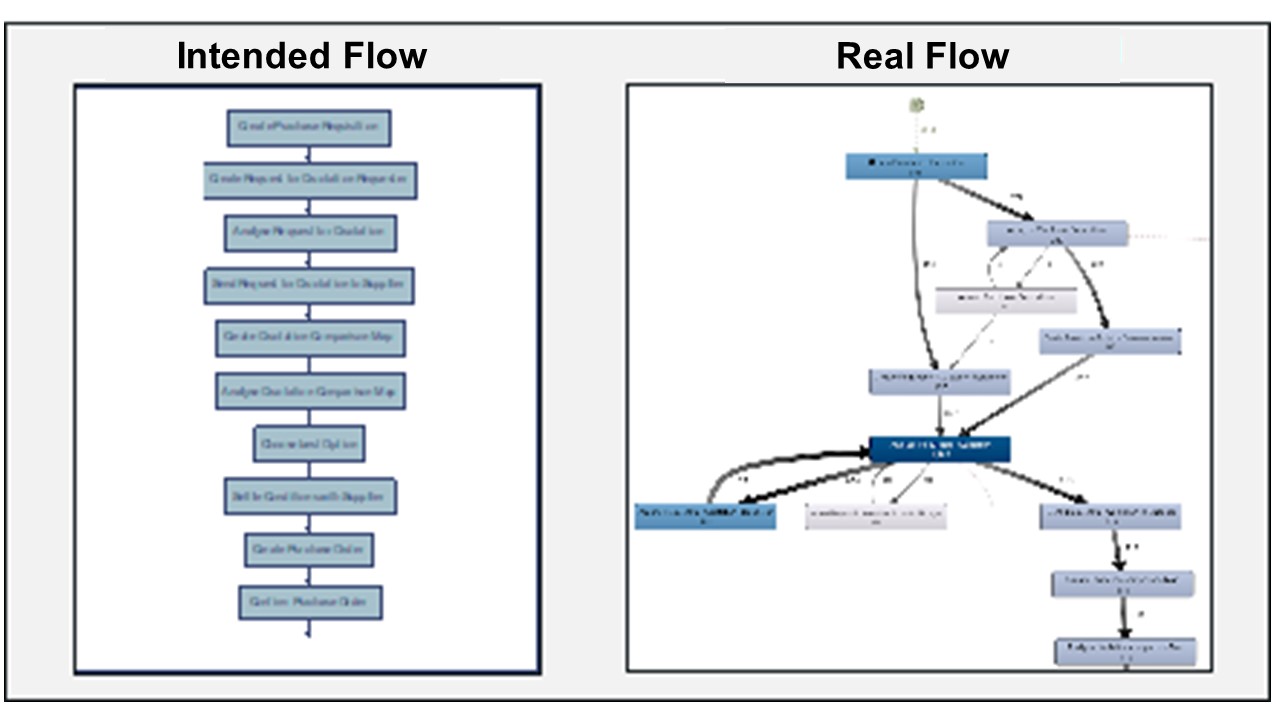 IT-systems into the Process Mining software tool and, literally at the touch of a button, it then displays your process, as it behaves in daily reality, with all the process variants, rework loops, bottlenecks, compliance issues and more. Static, as a process flow, and dynamic, in the form of an animation. In short, a fast and effective way to understand processes and make an effective impact on those things that really matter.